When it comes to Parts Planning, you know it’s hard enough to forecast what you’ll need to properly service customers in the future. (We covered that topic in part one of this blog series. Read it here if you haven’t yet!) And to make things more complicated, even if you had a crystal ball to help you create the perfect inventory list, it might not add up for you financially. To support your forecasted demand cost effectively, you need to get strategic to find your optimal target stock level for each part.
Cost-Optimized Target Stock Levels
Given the finite amount of cash companies have available to invest in service inventory, savvy Service Parts Planners must ensure they buy everything they need for their most critical parts, products, installations, and customers. On the other hand, they may need to settle on a lower service level, and lower inventory investments, for non-critical parts and products. A key step in drawing the line between “critical” and “non-critical” is to determine stockout costs, or how big of a loss it’ll be if material isn’t available when and where demand occurs. Then, you can compare this to the cost of inventory.
When balancing the cost of inventory against the cost of a stockout, inventory cost is easy to quantify: material cost plus all associated carrying costs. Calculating the cost of a stockout is more complex.
Here are some factors to consider:
1. Material importance:
- Some parts are more essential than others. For instance, a single point of failure (SPOF) part, the failure of which could halt an entire production line, has a higher stockout cost than a systemically redundant or purely decorative one. That said, it makes sense to maintain a higher service level on the SPOF part and take more risk on the others.
2.Product importance:
- For a newly launched flagship product shipping to customers who’ll become references for future sales, management may want to invest in a higher service level for all FRUs for that product. Stockout costs for newer products are higher than for the older versions.
3.Customer criticality:
- A single customer who has global installations and global service support contracts probably carries a higher stockout cost than a single customer with a single installation. Consider if there’s a supplier constraint: You only have one unit of a part, and two customers both need that part. Who gets it? Should it be whoever calls first? Whoever screams the loudest? Or should it be the customer who has the most cost associated with a stockout? You must answer this question when determining what quantities to stock at various locations.
4.Contract criticality:
- Consider service contracts that provide coverage twenty-four hours a day, seven days a week. Compare those to service contracts that require support only during business hours. Stocking for the full-coverage location should normally be considered more critical, carrying a higher stockout cost than the partial-coverage contract.
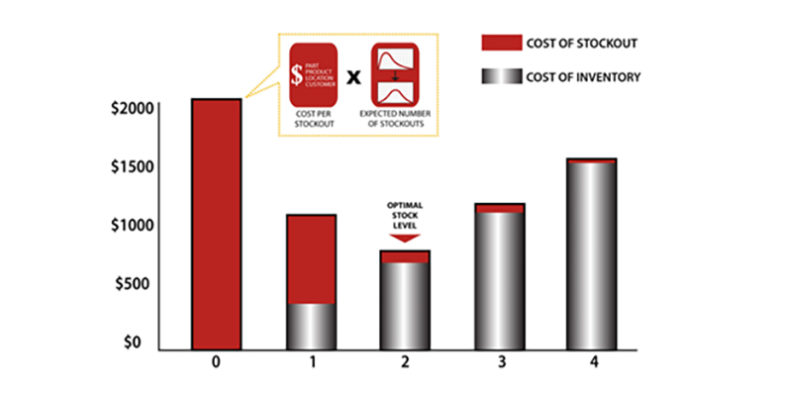
When you coalesce these parameters and understand which installed bases you’re supporting across stocking locations, you can calculate a cost-optimized target stock level for each part. First, calculate stockout costs by multiplying these two factors:
- Cost per stockout
- The expected number of stockouts: a function of the ability to fulfill the forecasted demand with the TSL, accounting for demand probability and replenishment lead times
As inventory increases, the cost per stockout stays constant, but the probability of a stockout decreases.

Monitoring and Continuous Improvement
Finally, you must monitor the effectiveness of your service parts material plan. This process goes deeper than determining if the parts got to the customer on time. That may be the metric you share externally, but it’s not detailed enough to drive your improvement strategy.
For example, you should also consider things like whether you got your parts delivered from the most cost-effective stocking location. If not, this is considered a “miss,” which you’ll want to analyze to prevent future instances.
Unplanned misses usually fall into the following categories:
- Data Driven:
- Material not on BOM
- No contract or installed base consensus
- Material Driven:
- Delinquent supply order
- Part level planning constraint
- Process Driven:
- TSL change not approved or effective
- Unfulfilled replenishment order
- Planned miss:
- Cost of stocking inventory exceeded the cost of a stockout
Your ability to drill into the root causes of these misses depends on the data you have available and the configuration options in your planning system. For best results, you should analyze your data daily, while the information is still fresh and accurate. This means that a manual approach to data analysis won’t work for most organizations.
Installed Base Data
When you have the right automated tools, processes, and disciplines in place, your installed base data becomes a treasure trove of insight to refine your service inventory plan. As we’ve covered in this blog series, you can use it to map demand as well as forecast and calculate target stock levels. Pair these efforts with a closed-loop process for feedback and continuous improvement, and you’ll enjoy lower inventory levels, higher service levels, and a consistently happy customer base.
For information on how Baxter Planning can help you meet your service supply chain goals with Installed Base Planning capabilities and more, visit us at www.baxterplanning.com.


